A new study by Suburbtrends revealed the 10 least pet-friendly suburbs in Australia when it comes to securing a property.
The research analysed rental listings across the country in the past three months, searching for keywords such as "no-pets" or "no-pets-allowed."
Over the period of 27 November 2022 to 12 February 2023, Suburbtrends analysed close to 300,000 listings and found 19,424 rentals containing the stipulation of no pets.
South Australia took out the top gong for the toughest state for pet-friendly rentals.
Oaklands Park in SA recorded a 67% search return for no pets, followed by Beresford in WA with 65%.
Suburbtrends Founder Kent Lardner said the ‘Sad Puppy Score,’ which measures the severity of the situation for renters, identified SA, WA, and Tasmania as the states where renters with pets are most vulnerable.
“The most difficult suburbs for renters with pets are those that receive the worst Sad Puppy Score, indicating a rent increase of 5% or more, vacancy rates below 1.5%, and over 30% of rental listings prohibiting pets" Mr Lardner said.
“Many suburbs in South Australia have vacancy rates of less than 1%, rents increasing at 10% or more, and more than 50% of advertised rentals prohibiting pets.
“Thus, many South Australian renters with pets may envy those residing in Victoria, the only state where renters with pets are not severely affected.”
According to Animal Medicines Australia, 69% of all households across the country own one or more pets.
Queensland and Victoria are the only states where landlords are legally unable to refuse pets in rental properties without providing reasonable grounds.
The top 10 national suburbs
| Suburb | Share of rental properties prohibiting pets | Vacancy rate | Rent increase | Overall 'Sad Puppy Score' |
| Oaklands Park, SA | 67% | 0.5% | 13% | 5 |
| Beresford, WA | 65% | 1.3% | 6% | 5 |
| Nuriootpa, SA | 63% | 0.9% | 19% | 5 |
| Batemans Bay, NSW | 58% | 2% | 15% | 4 |
| Glenelg, SA | 55% | 0.8% | 15% | 5 |
| Newton, SA | 55% | 0% | 14% | 5 |
| New Port, SA | 54% | 0.5% | 12% | 5 |
| Lithgow, NSW | 50% | 2.1% | 12% | 4 |
| Lambton, NSW | 48% | 0.7% | 11% | 5 |
| Semaphore Park, SA | 48% | 1.4% | 14% | 5 |
State by state “no pets allowed” breakdown
The suburbs listed in each state below show the share of rentals that prohibit pet ownership.
New South Wales
- Batemans Bay, 2536 - 58%
- Lithgow, 2790 - 50%
- Lambton, 2299 - 48%
- Ocean Shores, 2483 - 48%
- Hamilton South, 2303 - 47%
- Shortland, 2307 - 46%
- Sawtell, 2452 - 45%
- Eden, 2551 - 44%
- Unanderra, 2526 - 43%
- Bathurst, 2795 - 43%
Queensland
- Palm Cove, 4879 - 32%
- Bowen, 4805 - 22%
- Main Beach, 4217 - 20%
- Mackay, 4740 - 20%
- East Mackay, 4740 - 17%
- Buddina, 4575 - 17%
- Scarness, 4655 - 17%
- Sippy Downs, 4556 - 17%
- Springfield, 4300 - 16%
- Mount Pleasant, 4740 - 16%
South Australia
- Oaklands Park, 5046 - 67%
- Nuriootpa, 5355 - 63%
- Glenelg, 5045 - 55%
- Newton, 5074 - 55%
- New Port, 5015 - 54%
- Semaphore Park, 5019 - 48%
- Glenside, 5065 - 48%
- Brooklyn Park, 5032 - 47%
- Henley Beach, 5022 - 47%
- Glenelg East, 5045 - 17%
Western Australia
- Beresford, 6530 - 65%
- Margaret River, 6285 - 44%
- Ardross, 6153 - 41%
- Shoalwater, 6169 - 41%
- Maylands, 6051 - 40%
- Joondalup, 6027 - 40%
- Jindalee, 6036 - 39%
- Harrisdale, 6112 - 37%
- Bunbury, 6230 - 36%
- Noranda, 6062 - 36%
Tasmania
- Wynyard, 7325 - 38%
- Devonport, 7310 - 36%
- Sorell, 7172 - 33%
- West Moonah, 7009 - 29%
- Mount Stuart, 7000 - 27%
- Sandy Bay, 7005 - 25%
- Claremont, 7011 - 25%
- Battery Point, 7004 - 25%
- West Hobart, 7000 - 24%
- Hobart, 7000 - 23%
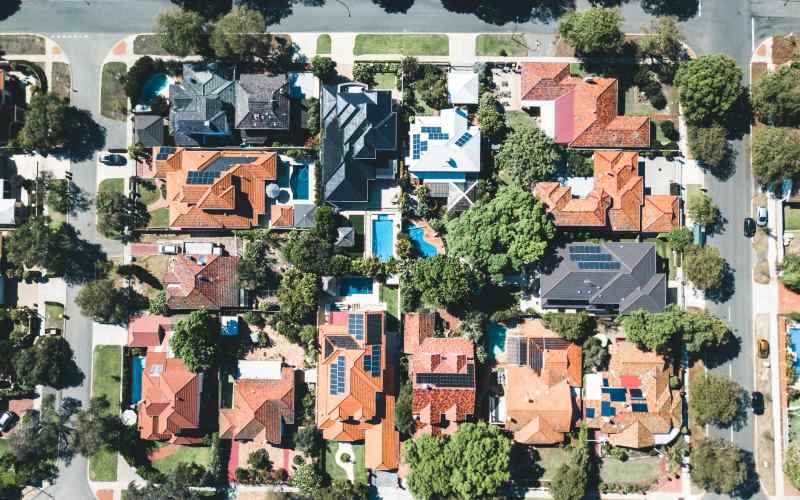
Image by Andrew S via Unsplash

Ready, Set, Buy!
Learn everything you need to know about buying property – from choosing the right property and home loan, to the purchasing process, tips to save money and more!
With bonus Q&A sheet and Crossword!


 William Jolly
 Emma Duffy