That's according to a new report from the National Housing Finance and Investment Corporation (NHFIC), which found little to no migration, coupled with the COVID-fallout, would seen an abundance of housing.
The report projected rental affordability would improve in the next two years in densely populated eastern seaboard cities, as there are fewer households forming to soak up the new supply.
However, it warned of a sharp rebound in demand after 2025 and noted longer term trends of declining affordability, particularly for prospective first-home buyers looking to transition to home ownership, would persist if supply wasn't responsive to this rebound in demand.
Buying a home or looking to refinance? The table below features home loans with some of the lowest variable interest rates on the market for owner occupiers.
| Lender | Home Loan | Interest Rate | Comparison Rate* | Monthly Repayment | Repayment type | Rate Type | Offset | Redraw | Ongoing Fees | Upfront Fees | LVR | Lump Sum Repayment | Additional Repayments | Split Loan Option | Tags | Features | Link | Compare |
|---|---|---|---|---|---|---|---|---|---|---|---|---|---|---|---|---|---|---|
6.04% p.a. | 6.06% p.a. | $2,408 | Principal & Interest | Variable | $0 | $530 | 90% | Featured 4.6 Star Customer Ratings |
| |||||||||
5.99% p.a. | 5.90% p.a. | $2,396 | Principal & Interest | Variable | $0 | $0 | 80% | Featured Apply In Minutes |
| |||||||||
6.09% p.a. | 6.11% p.a. | $2,421 | Principal & Interest | Variable | $0 | $250 | 60% | Featured Unlimited Redraws |
|
NHFIC analysis found households in the third income quintiles living in the greater Sydney region can now only afford 10% of properties, compared with 25% in 1998.
However, first-home buyers have been taking advantage of the recent drop in house prices, record low interest rates and government stimulus, accounting for more than 40% of total new housing loans, 10% higher than the long-term average.
NHFIC CEO Nathan Dal Bon said the housing market had performed far better through the pandemic than many people had forecast.
“While there have been many challenges during 2020, there has also been a great degree of resilience in the property sector to date," Mr Dal said.
"Due to historically low interest rates and government stimulus, construction activity and housing prices have held up better than many anticipated.
“COVID-19 has changed the way we live and work with implications for housing demand, supply and affordability across all of Australia’s housing markets."
The pandemic is expected to trigger a fall in demand for housing of 286,000 dwellings over the next five years, with new supply expected to outstrip demand by 127,000 dwellings in 2021, and 68,000 dwellings in 2022.
Cumulative new supply is expected to outstrip demand by around 93,000 dwellings by 2025, but should international borders open sooner than expected and migration resumes, this excess supply may be negligible.
The Federal Government's HomeBuilder scheme and a range of other factors have led the recovery from the pandemic in the construction industry, mostly driven by detached housing.
Total net additions is expected to 181,000 in 2021 from 170,000 in 2020, on the back of monetary and fiscal support seen this year.
Net additions is likely to fall in the medium to long term before recovering to 148,000 in 2025.
Weakness in net apartment additions will potentially extend to 2025, when 27,000 new dwellings are expected, similar to levels seen prior to the apartment boom.
Despite record levels of construction over the years prior to COVID-19, supply outpaced demand by only 4,500 dwellings on average, for the years 2017-19.
The report said COVID-19 gave the industry a chance to review how migration could affect housing affordability.
"A lower period of housing demand due to the global pandemic presents an opportunity to revisit housing policy frameworks – particularly planning frameworks – to ensure that policies can accommodate future population growth without adverse consequences for affordability," it said.
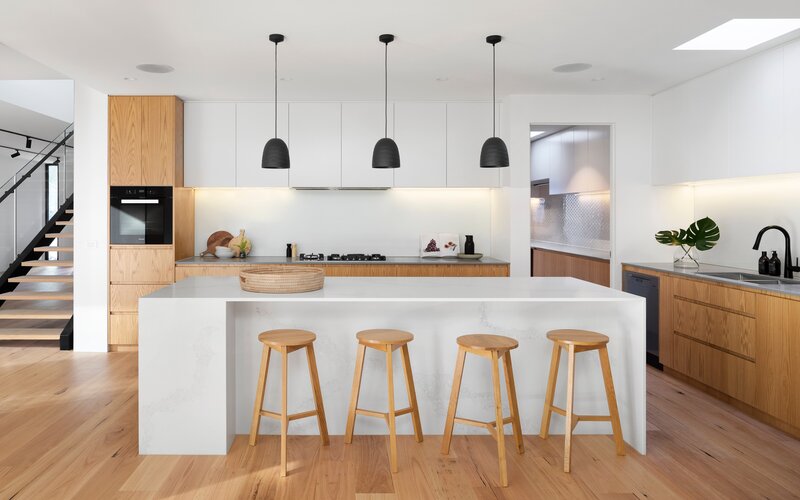
Photo by Benn McGuinness on Unsplash

Ready, Set, Buy!
Learn everything you need to know about buying property – from choosing the right property and home loan, to the purchasing process, tips to save money and more!
With bonus Q&A sheet and Crossword!


 Emma Duffy
 Harrison Astbury
 Rachel Horan

 Aaron Bell

